Want to see something weird?
The Logistics Map is the iterative function: xn+1 = a*xn*(1-xn) where xn is some number between zero and 1, non-inclusive, alpha is a number between zero and 4, and xn+1 is the number you get when you do the math on xn.
So pick an x value arbitrarily: 0.6. x1 = 0.6
Pick alpha arbitrarily: 3.56995. alpha = 3.56995.
x2 = 3.56995 *0.6 * (1-0.6) =3.56995*0.6*0.4= 0.854388
That’s xn+1. xn in this case is x1. Think of xn+1 as being the next x. So you have a first x, 0.6, and the next x is 0.854388, and the next x is 0.438041158193768.
I picked the alpha because the numbers are highly chaotic and don’t go outside (0,1). The parenthesis means 0 and 1 are not included.
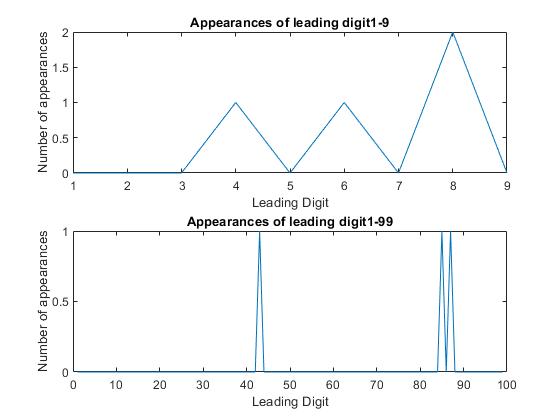
Then, for funsies, I bin the leading digits. So x1 is 6, x2 is 8, x3 is 4, etc. Zeros are never leading digits, so if a number was 0.0002, the leading digit would be 2. For extra funsies, I do the same for the first two digits below. (The images are named after the number of times I go through the function, so they’re 10s +1)
This is the plot of the first 11 values:
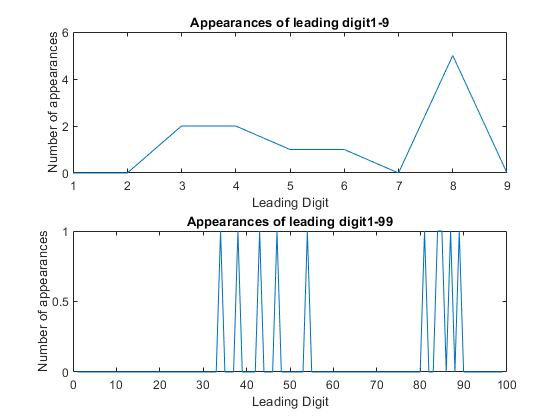
Okay, so what?
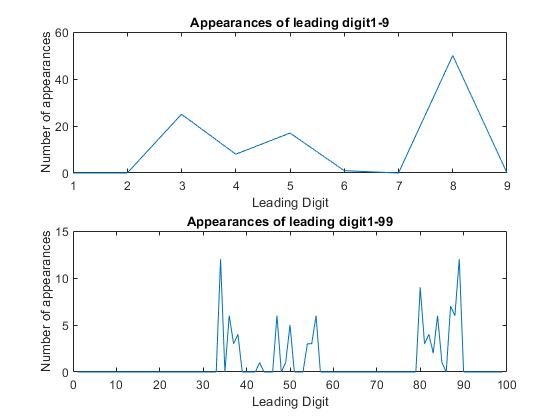
This is the first 101 values:
This is the first 10,001:
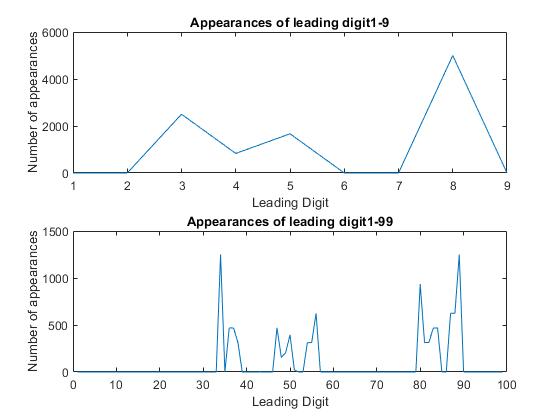
The shape doesn’t change. Oh, it squiggles a little. Here’s the first 4:
Other than resolution improvements, the shape remains basically the same for the leading digit graph. Does it do that for the double leading digit graph?